

Most engineering teams have a delivery problem they cannot see clearly. Releases feel slow, bugs keep escaping to production, and when something breaks it can take hours or days to restore service. But without a measurement system, every fix is a guess.
Software delivery performance gives you the numbers to stop guessing. The four DORA metrics, Deployment Frequency, Lead Time for Changes, Change Failure Rate, and Mean Time to Restore, are the industry standard for a reason: they measure what actually determines whether your team ships value fast and recovers well when things go wrong.
This article explains what each metric means, how to collect the data without adding manual overhead, and what separates teams that improve quarter over quarter from teams that stay stuck. By the end, you will know exactly what to track and where to start.
Table of Contents
Key Takeaways
- DORA metrics are the baseline: Deployment Frequency, Lead Time for Changes, Change Failure Rate, and Mean Time to Restore reliably predict whether a team is high-performing or struggling.
- Speed and stability are not a trade-off: Research from Google Cloud’s DORA team shows elite teams improve both simultaneously. If your team trades quality for speed, the measurement system is the problem.
- Automate data collection from day one: Metrics pulled manually reflect what people remember, not what happened. Connect your CI/CD pipeline, version control, and incident tracker for accurate numbers.
- Fix the worst bottleneck first: Identify which single metric is furthest from benchmark, run one focused improvement experiment, and re-measure before moving on.
- Your delivery partner’s practices affect your scores: An offshore team that skips CI/CD, avoids automated tests, or operates in a separate incident system will drag down every metric you are trying to improve.
Further Reading
What software delivery performance actually measures
Software delivery performance measures how fast and reliably an engineering team moves code from development to production. It covers the full cycle, from the moment a developer commits a change to the moment that change is live for users, and tracks both the speed of that journey and the quality of what arrives at the end.
The reason this matters to decision-makers is direct: delivery performance is a leading indicator of product competitiveness. Teams that deploy frequently and recover from failures quickly can respond to customer feedback in days, not months. Teams that cannot are always playing catch-up.
The DORA framework, developed by Google Cloud’s DevOps Research and Assessment team after years of large-scale studies across thousands of organizations, identified four metrics that reliably separate high performers from low performers. They are not the only metrics worth tracking, but they are the right place to start.
Why lines of code and story points are the wrong metrics
Many teams default to measuring output: tickets closed, story points burned, code committed. These numbers are easy to collect, but they measure activity, not value delivered.
A team that closes 40 tickets per sprint but deploys once per month is not a high-performing team. A team that ships 10 changes per day and restores service within an hour when something fails is. The difference is not effort. It is the structure of how code moves through the system.
Measuring lines of code or velocity also creates the wrong incentives. Developers optimize for what gets measured. If the metric is story points, estimates inflate. If the metric is commit count, commits fragment. DORA metrics are harder to game because they measure systemic outcomes, not individual activity.
The four DORA metrics explained
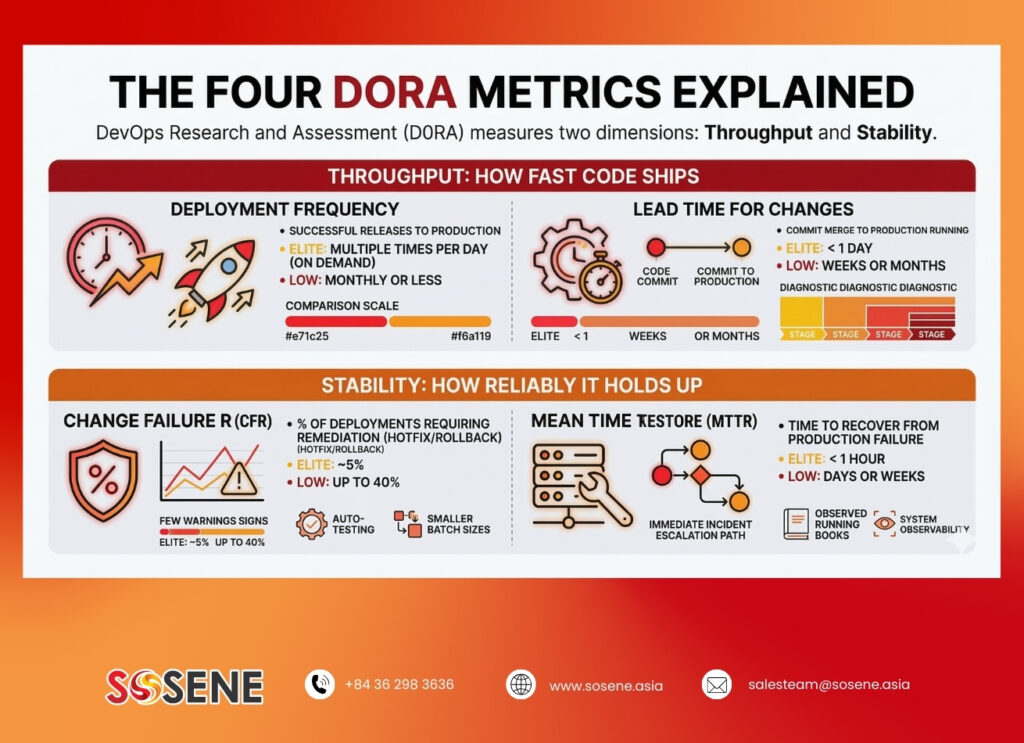
The four DORA metrics cover two dimensions of delivery performance: throughput (how fast code ships) and stability (how reliably it holds up). High-performing teams score well on both, which disproves the common assumption that speed and quality are a forced trade-off.
Deployment Frequency
Deployment Frequency measures how often a team successfully releases code to production. Elite teams deploy multiple times per day, often on demand. Low-performing teams deploy monthly or less frequently.
Low deployment frequency is usually a symptom of large batch sizes. Teams accumulate too many changes before shipping because the release process is complex or risky. Reducing batch size by merging smaller, more frequent changes is the single most reliable lever for improving this metric.
Lead Time for Changes
Lead Time for Changes is the time between a code commit being merged and that code running in production. For elite teams, this is under one day. For low performers, it stretches to weeks or months.
Long lead times typically indicate bottlenecks in code review, test suite execution time, or manual deployment steps. A useful diagnostic: time each stage of your pipeline separately. In most teams with long lead times, code review accounts for more than half the total duration.
Change Failure Rate
Change Failure Rate (CFR) is the percentage of production deployments that cause a failure requiring immediate remediation, such as a hotfix, rollback, or emergency patch. Elite teams maintain a CFR around 5%. Low-performing teams see failure rates as high as 40%.
A high CFR usually points to one of two problems: insufficient automated test coverage, or deployments that are too large to review and validate properly. Both are structural issues, not engineering talent issues.
Mean Time to Restore
Mean Time to Restore (MTTR) measures how long it takes to recover from a production failure. Elite teams restore service in under one hour. Low performers take days or weeks.
MTTR is as much an organizational metric as a technical one. Teams that restore service quickly have clear incident escalation paths, good system observability, and practiced runbooks. Teams with long MTTR often lack any of the three.
How to collect the data without creating overhead
Reliable measurement of software delivery performance requires automated data collection from the systems where work actually happens. Manual tracking produces numbers that reflect what people remember or choose to report, which is rarely accurate.
| Metric | Primary data source | Tools that automate collection | Elite benchmark |
|---|---|---|---|
| Deployment Frequency | CI/CD pipeline deployment logs | GitHub Actions, GitLab CI/CD, Harness | Multiple times per day |
| Lead Time for Changes | Version control + deployment timestamp | LinearB, Sleuth, Waydev | Under one day |
| Change Failure Rate | Incident tracker linked to deployments | PagerDuty, OpsGenie, Jira Service Mgmt | ~5% |
| Mean Time to Restore | Incident open/close timestamps | PagerDuty, Statuspage, Datadog | Under one hour |
The key integration requirement is linking your deployment events to your incident data. Most teams have both systems running in parallel but never connected. Without that link, you cannot calculate Change Failure Rate accurately. You end up manually correlating deploy logs with incident tickets, which takes hours and introduces error.
A note on cross-team and offshore measurement
One objection that comes up consistently from companies managing offshore development teams: “We cannot measure the offshore team’s delivery performance the same way we measure our internal team.”
This is a solvable problem, not a structural limitation. The requirement is that both teams share the same CI/CD pipeline and incident management system, or that data from both is fed into a unified analytics layer. Platforms like LinearB and Sleuth aggregate deployment and incident data from multiple repositories and teams into a single dashboard.
If an offshore vendor operates in a completely separate toolchain with no data integration into your systems, that is worth flagging before signing a contract. It means you will have no visibility into their delivery performance, only into their outputs.
What actually improves software delivery performance
Improving software delivery performance follows a consistent pattern across engineering teams: measure the worst metric first, identify the structural cause, run a targeted experiment, and re-measure before touching anything else.
Improving Deployment Frequency and Lead Time
The most reliable improvements to both metrics come from reducing the size of individual deployments. Smaller pull requests move through code review faster, catch failures within a narrower blast radius, and ship to production more frequently. Teams that shift to trunk-based development, merging into the main branch multiple times per day rather than maintaining long-lived feature branches, see Lead Time improvements of 40 to 60% within two to three sprints.
Feature flags are the practical mechanism that makes this safe. Wrapping new code in flags lets developers merge and deploy changes to production without activating them for users. A fintech client we worked with on a core payments module needed the safety of dark launching before activating for customers. Feature flags reduced their effective deployment risk to near zero while keeping lead time low.
Improving Change Failure Rate
High CFR is almost always a test coverage problem or a code review process problem. Teams with CFR above 15% typically have one of these: no automated integration tests, manual-only QA before release, or pull requests that are too large to review meaningfully.
Adding automated integration tests to the CI pipeline is the highest-leverage fix. For teams with an existing backlog of untested code, the practical approach is to add test coverage as part of each bug fix, a pattern sometimes called “test on touch.” After six months, coverage builds itself into the areas that matter most.
"Across custom software engagements in logistics and manufacturing, the teams with the lowest Change Failure Rates share one structural trait: every bug fix ships with a regression test. Not occasionally. Every time."
Sosene Team
Improving Mean Time to Restore
Reducing MTTR requires three things: fast detection, fast diagnosis, and practiced recovery. Most teams have gaps in all three.
Fast detection means monitoring that fires on business-level anomalies, not just server health. If an API endpoint starts returning errors at three times the normal rate, an alert should fire within minutes. If the only alert is CPU utilization, a silent failure can run for hours before a customer reports it.
Fast diagnosis requires good observability: structured logs, distributed traces, and dashboards that let on-call engineers find the root cause without reconstructing what happened from memory. Teams that invest in observability infrastructure typically cut their MTTR by half within a quarter of instrumenting properly.
What should a software delivery analyst actually track?
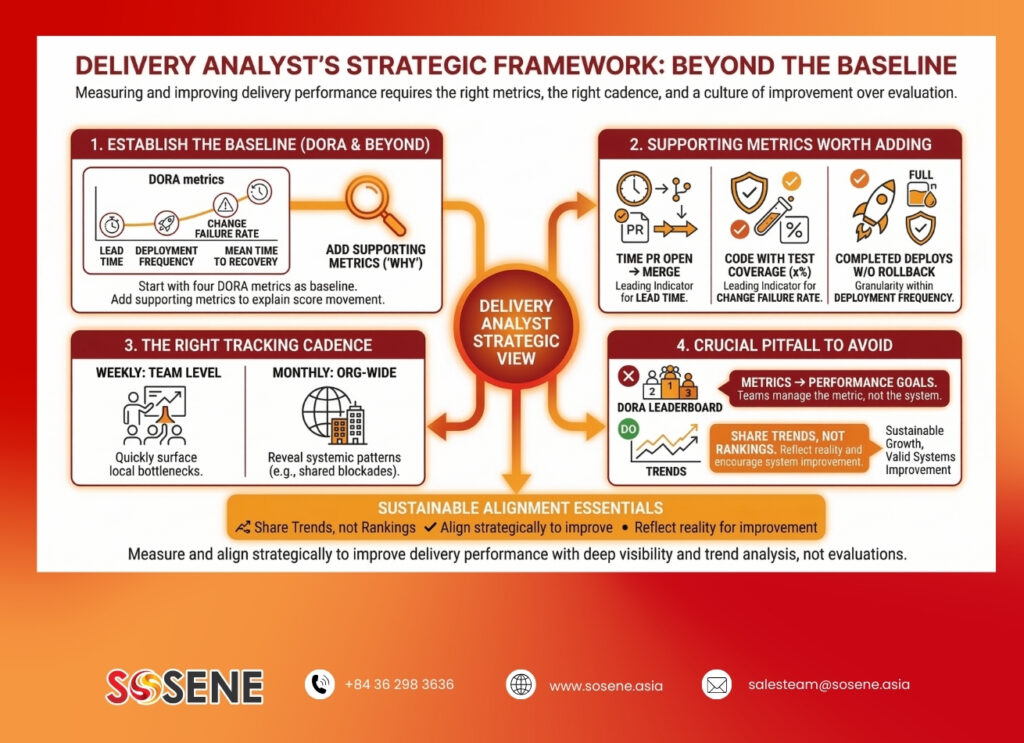
A software delivery analyst responsible for measuring and improving delivery performance should start with the four DORA metrics as the baseline, then add three supporting metrics that explain the “why” behind any score movement.
The supporting metrics worth adding: Code Review Cycle Time (time from PR open to merge, which is the leading indicator for Lead Time), Test Coverage percentage (leading indicator for Change Failure Rate), and Deployment Success Rate (deployments that completed without rollback, which adds granularity within Deployment Frequency data).
Analysts often ask whether to track these per team or across the whole engineering organization. The answer is both, at different cadences. Weekly reviews at the team level surface bottlenecks quickly. Monthly reviews at the organizational level reveal systemic patterns, for example whether a shared QA environment is blocking multiple teams simultaneously.
One thing to avoid: publishing a DORA leaderboard that ranks teams against each other. Metrics that become performance evaluations stop reflecting reality within one quarter. Teams start managing the metric instead of improving the system. Share trends, not rankings.
How Sosene approaches software delivery performance

Companies that engage Sosene for custom software development typically arrive with one of two delivery problems: their existing product ships too slowly to stay competitive, or they have inherited a codebase with no automated testing and a change failure rate that makes every release feel like a risk.
We treat delivery performance as an engineering infrastructure problem, not a process problem. Before writing a line of feature code on a new engagement, we align on the CI/CD pipeline architecture, agree on test coverage standards, and connect deployment events to incident management. That setup work is what makes DORA metrics measurable from the start rather than something teams try to bolt on later.
The right starting point depends on where your current bottleneck sits. Some clients need a dedicated delivery team that ships features faster. Others need an architecture review before adding more engineers makes sense.
If you want to see how this works in practice, the IT Consulting and Advisory service is the right place to start. It is a structured engagement designed to assess your current delivery pipeline and identify the highest-leverage improvements before committing to a longer build.
Conclusion
Software delivery performance comes down to four numbers: how often you deploy, how fast changes reach production, how frequently deployments break things, and how quickly you recover when they do. Track those four metrics consistently and you have a clear picture of where your team actually stands.
The improvement path is straightforward in principle. Automate data collection, identify the worst metric, fix the structural cause, and remeasure. What makes it hard in practice is that structural causes such as lack of automated tests, fragmented tooling, large batch sizes, and poor observability require real investment before they improve.
That investment is easier to justify once you can show what the current state costs. A Change Failure Rate of 30% and a Mean Time to Restore of two days is not just an engineering problem. It is a customer trust problem and a revenue problem.
If you are evaluating an offshore software development partner, start by asking how they measure delivery performance on existing engagements. The answer tells you more about their engineering culture than any case study. See how Sosene structures software development engagements for teams that need measurable, consistent delivery.
FAQs
What are the four DORA metrics for measuring software delivery performance?
The four DORA metrics are Deployment Frequency, Lead Time for Changes, Change Failure Rate, and Mean Time to Restore. These metrics were developed by Google Cloud’s DevOps Research and Assessment team and are the industry standard for measuring how fast and reliably engineering teams deliver software to production.
How do I improve software delivery performance in an agile team?
Improving agile software delivery performance typically starts with reducing deployment batch size. Smaller, more frequent releases lower risk and shorten lead time. Supporting changes include automating test coverage within the CI/CD pipeline, shifting to trunk-based development rather than long-lived feature branches, and connecting monitoring to business-level alerts so failures surface quickly.
What does a software delivery analyst do?
A software delivery analyst measures and interprets delivery performance data to identify bottlenecks and improvement opportunities across the engineering pipeline. In practice, this means tracking DORA metrics alongside supporting indicators like Code Review Cycle Time and Test Coverage, running retrospective analyses after incidents, and presenting trend data to engineering leadership to guide pipeline investment decisions.
Can offshore software delivery teams be measured the same way as internal teams?
Yes, provided both teams share a CI/CD pipeline or feed deployment data into a unified analytics platform. Tools like LinearB and Sleuth aggregate delivery metrics across multiple repositories and teams, including offshore contributors. The prerequisite is that the offshore vendor operates within your agreed toolchain rather than a completely separate one with no data integration.
What is a realistic target for Lead Time for Changes in online software delivery?
For teams with a well-structured CI/CD pipeline and automated test coverage, a Lead Time for Changes under one day is achievable within two to three quarters of focused improvement. Most teams starting from a baseline of one to two weeks see the biggest gains by reducing pull request size and eliminating manual handoff steps between code review and deployment.