

Why architecture becomes a business problem at scale
As systems grow, software architecture at scale stops being a technical discussion and becomes a financial and operational reality. The same design decisions that once enabled speed begin to slow delivery, inflate cloud spend, and increase risk exposure.
Most organizations never experience a dramatic “architecture failure.” Instead, they feel it gradually: features take longer to ship, incidents become routine, cloud bills rise faster than revenue, and confidence in change erodes.
If your system still works but feels increasingly expensive to operate and change, architecture is likely the silent multiplier. This article explains how that multiplier works, how leaders can detect it early, and how teams can reduce cost and risk without stopping product delivery.
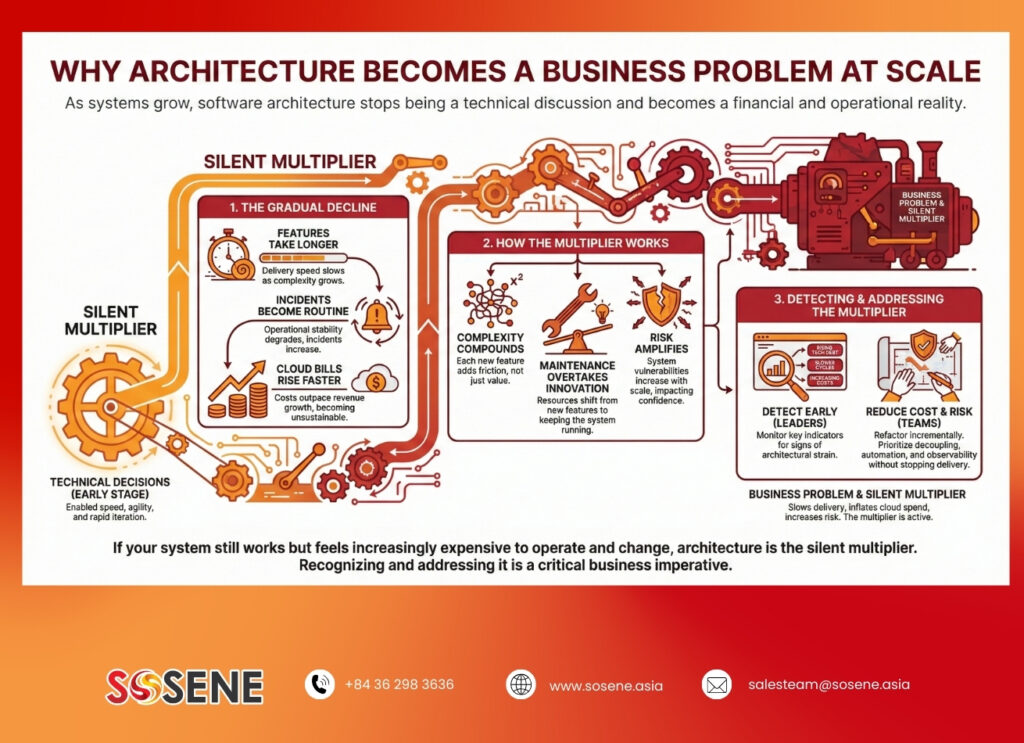
Table of Contents
Key Takeaways
- Architecture compounds cost over time. Small inefficiencies become structural losses as traffic, data, and teams scale.
- The biggest costs are indirect. Productivity loss, delivery drag, cloud waste, and security exposure outweigh visible outages.
- Problems surface as symptoms, not failures. Rising lead time, cloud spend, and incident load are early signals.
- Architecture can be measured in business terms. Lead time, MTTR, availability, and cost per request translate design into impact.
- High-ROI fixes rarely require rewrites. Boundary clarity, guardrails, and observability deliver faster returns.
Further Reading
What software architecture really means in real systems
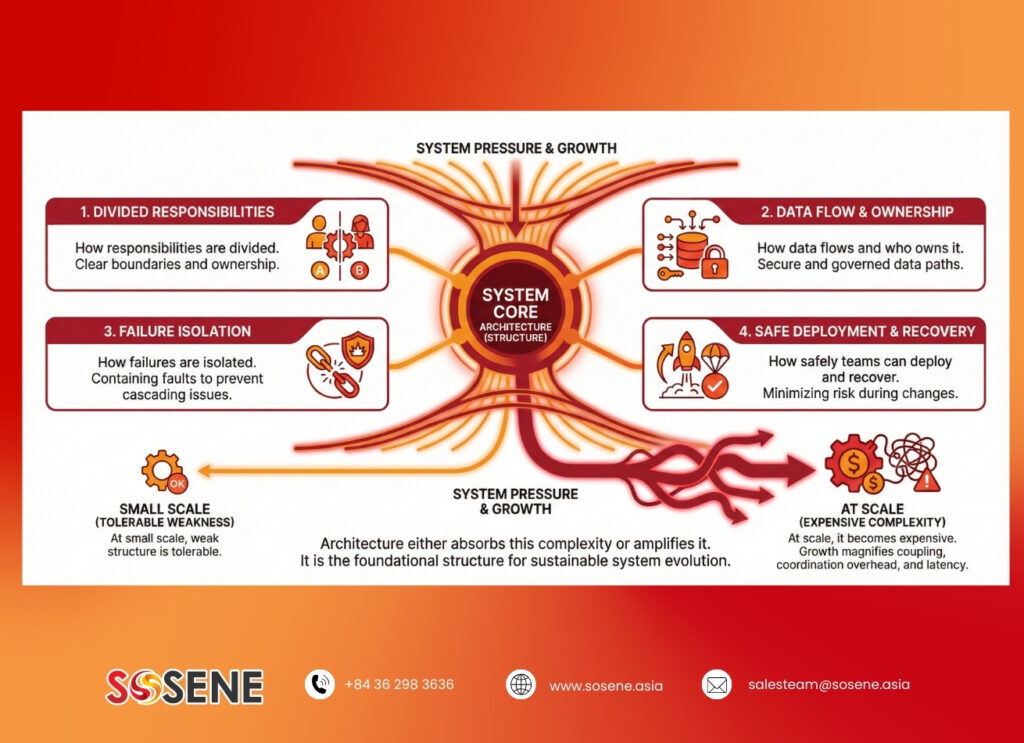
Software architecture is not a framework or deployment model. It is the structure that determines how systems change under pressure.
In practice, architecture defines:
- How responsibilities are divided.
- How data flows and who owns it.
- How failures are isolated.
- How safely teams can deploy and recover.
At small scale, weak structure is tolerable. At scale, it becomes expensive. Growth magnifies coupling, coordination overhead, and latency. Architecture either absorbs this complexity or amplifies it.
The silent tax of poor architecture at scale
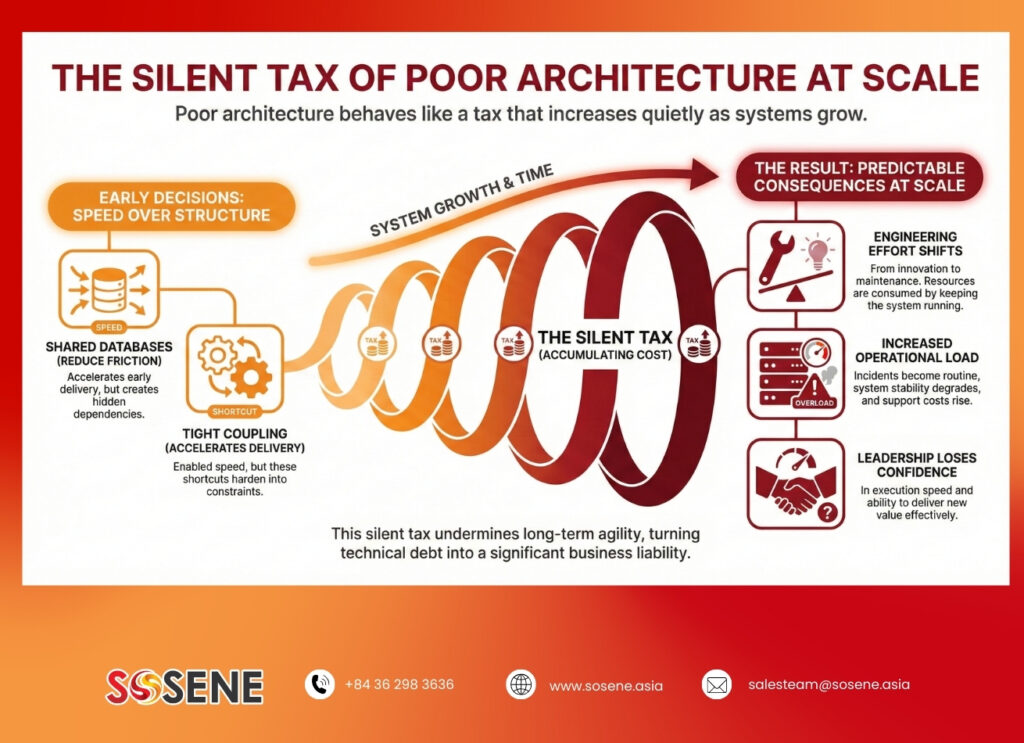
Poor architecture rarely shows up as a single line item. Instead, it behaves like a tax that increases quietly as systems grow.
Early decisions feel “fine” because speed matters more than structure. Shared databases reduce friction. Tight coupling accelerates early delivery. Over time, those shortcuts harden into constraints.
The result is predictable: engineering effort shifts from innovation to maintenance, operational load increases, and leadership loses confidence in execution speed.
Where the real costs hide
1. Engineering productivity erosion
Architecture quality determines how much engineering spend produces customer value.
| Signal Observed | Architectural Cause | Business Impact |
|---|---|---|
| Features take longer each quarter | Tight coupling, unclear boundaries | Slower time-to-market |
| Rework dominates sprints | Accumulated technical debt | Lower ROI on engineering spend |
| Only a few people “know the system” | Poor discoverability, weak ownership | Delivery risk and burnout |
| More meetings to ship changes | Shared modules, unclear contracts | Coordination overhead |
This is not a one-time problem. It is a recurring delivery tax that compounds every sprint.
2. Runaway operational and cloud spend
Cloud costs rarely scale linearly with users when architecture is inefficient.
| Cost Driver | Architectural Pattern | Resulting Impact |
|---|---|---|
| Chatty services | Excessive synchronous calls | Higher compute and network cost |
| Inefficient queries | Poor data access boundaries | Expensive storage and CPU usage |
| Missing caching | Stateless but unoptimized flows | Cost per request increases |
| Logging and metrics bloat | High-cardinality observability | Avoidable ingestion and retention cost |
Many teams only notice these issues when they hit a scale cliff, forcing expensive mid-flight redesigns under pressure.
3. Reliability, security, and reputation loss
Fragile architecture converts normal variation into incidents.
| Symptom | Structural Cause | Business Consequence |
|---|---|---|
| Frequent incidents | Tight coupling, shared failure domains | Customer trust erosion |
| Slow recovery (high MTTR) | Poor isolation, unclear ownership | SLA penalties, churn risk |
| Security drift | Duplicated auth and policy logic | Increased exposure |
| Performance degradation | Latency compounding across services | Conversion loss |
Reliability is not an engineering vanity metric. It directly impacts revenue and brand trust.
4. Data quality erosion and decision delay
Weak data architecture undermines analytics and operational decision-making.
Multiple “sources of truth,” unclear domain ownership, and conflicting writes lead to metric disputes and reconciliation work. Over time, leaders stop trusting dashboards and delay decisions.
Poor data lineage also creates compliance and customer-facing risk, turning data correctness into a product concern.
How leaders can spot architecture problems without reading code
Architecture risk can be detected through executive-friendly signals.
| Category | Metric to Watch | What It Often Indicates |
|---|---|---|
| Delivery | Lead time increasing | Coupling and coordination drag |
| Reliability | MTTR rising | Weak isolation and ownership |
| Cost | Cloud spend per user rising | Inefficient architecture patterns |
| Quality | Rollbacks increasing | Fragile release boundaries |
| Operations | Incident volume trending up | Structural instability |
When multiple signals move together, architecture is usually the root cause.
Architecture types and their real cost trade-offs
Architecture choices should be evaluated by constraints, not trends.
| Architecture Type | Strengths | Hidden Costs |
|---|---|---|
| Layered monolith | Low overhead, fast early delivery | Risk of hidden coupling |
| Modular monolith | Strong boundaries, lower ops cost | Requires discipline |
| Microservices | Isolation, independent scaling | Coordination and observability overhead |
| Event-driven | Loose coupling, async resilience | Operational complexity |
| Streaming | Real-time data flow | Tooling and skill cost |
The right choice depends on team maturity, deployment needs, domain complexity, and reliability targets not hype.
A practical diagnosis framework: from symptom to root cause
High-ROI architecture work starts by mapping pain to impact.
| Visible Symptom | Likely Constraint | Measurable Impact |
|---|---|---|
| Slow releases | Boundary violations | Increased lead time |
| Rising cloud bills | Inefficient data flow | Higher cost per request |
| Frequent incidents | Shared failure domains | Lower availability |
| Data disputes | Unclear ownership | Decision delay |
In most systems, boundary problems — ownership, coupling, and data flow — deliver the fastest returns when fixed.
A clear software architecture diagram is often enough to expose these risks quickly.
Reducing cost without a rewrite: a staged fix plan
Most systems cannot pause delivery. The goal is to reduce risk incrementally.
| Stage | Focus | Outcome |
|---|---|---|
| Baseline | Lead time, MTTR, availability, cost per request | Shared understanding |
| Guardrails | Timeouts, retries, rate limits, safe rollouts | Risk containment |
| Boundary refactor | Clear contracts, reduced shared state | Lower coordination cost |
| Observability | Actionable metrics, not noise | Faster decisions |
| Debt budgeting | Planned, visible remediation | Sustained velocity |
Rewrites are rare. Incremental structural improvement usually delivers higher ROI with less risk.
What makes a software architecture diagram actually useful
A good diagram supports both leadership and engineering execution.
It should clearly show:
- System context and major dependencies.
- Containers, components, and data flow.
- Ownership and reliability boundaries.
- Failure isolation points.
Keeping diagrams lightweight and updated during delivery prevents them from becoming obsolete documentation.
How Sosene helps teams reduce architecture cost at scale

Sosene works with growing teams to turn architecture from an abstract concern into a measurable business lever.
Rather than opinion-driven reviews, Sosene assesses systems through delivery, reliability, and cost signals. Teams receive a prioritized remediation roadmap that avoids the “rewrite reflex” and protects product velocity.
Sosene supports execution across boundary refactoring, observability improvement, and governance design — helping organizations scale without silently multiplying cost.
If you want to understand what your architecture is really costing you, start a conversation with Sosene
FAQs
What is software architecture, and why does it matter more at scale?
Software architecture defines system structure and changeability. At scale, inefficiencies compound into cost, risk, and delivery drag.
What are the clearest signs that poor architecture is increasing costs?
Rising lead time, cloud spend per user, frequent incidents, and slow recovery are common indicators.
When is a rewrite justified versus incremental refactoring?
Rewrites are justified only when constraints block all progress. Incremental, boundary-focused refactoring usually delivers higher ROI.
How can leaders measure the business impact of architecture improvements?
Track lead time, MTTR, availability, and cost per request before and after changes.
What should a software architecture diagram include for scalable systems?
Context, containers, data flow, ownership, and failure boundaries.